The tests were run only on 64-bit systems.
Switches
The following switch was used:- 1GBps: Dell
Power Connect 5224 (24 port gige L2 managed switch) with jumbo
frames enabled. All NICs had MTUs of 9000 bytes.
Network
Note that neither the network nor the test machines were reserved exclusively for the performance tests, so some ofthe fluctuations are explained by the fact that other users/processes were using the machines and/or generating traffic on
the network. This was mitigated somewhat by running all tests in the AM hours (8am - 3pm) in Europe, when the servers in
Atlanta GA were mostly idle. We also used machine which have no cron jobs (like cruisecontrol etc) scheduled that could interfere
with the tests.
JVM configuration
The following JVMs were used:- SUN JDK 1.5.0_11-b03
-server -Xmn300M -Xmx400M -Xms400M -XX:+UseParallelGC -XX:+AggressiveHeap -XX:CompileThreshold=100 -XX:SurvivorRatio=8 -XX:TargetSurvivorRatio=90 -XX:MaxTenuringThreshold=31 -Dlog4j.configuration=file:/home/bela/log4j.properties -Djgroups.bind_addr=${MYTESTIP_1} -Dcom.sun.management.jmxremote -Dresolve.dns=false
Design of the tests
The goal of the test is to measure the time it takes to reliably send N messages to all nodes in a cluster. (We are currently not interested in measuring remote group RPC, this may be done in a future performance test.) The test works as follows.- All members have access to 2 configuration files: one for defining the number of messages to be sent, the number of cluster members, senders etc, and the other one defining the JGroups protocol stack.
- N processes are started. They can be started on the same machine, but for better results there is one JGroups process per box
- The processes join the same group, and when N equals the cluster size defined in the configuration file, all senders start sending M messages to the cluster (M is also defined in the configuration file).
- Every node in the cluster receives the messages (senders are also receivers). When the first message is received, the clock is started. When the last message is received the clock is stopped. Every member know how many messages are to be received: <number of senders> * <number of messages>. This allows every receiver to compute the message rate and throughput (we also know the size of each message).
The configuration file (config.txt) is shown below (only the JGroups configuration is shown):
# Class implementing the org.jgroups.tests.perf.Transport interface


transport=org.jgroups.tests.perf.transports.JGroupsTransport

#transport=org.jgroups.tests.perf.transports.UdpTransport

#transport=org.jgroups.tests.perf.transports.TcpTransport


# Number of messages a sender sendes

num_msgs=1000000


# Message size in bytes

msg_size=1000


# Expected number of group members

num_members=2


# Number of senders in the group. Min 1, max num_members

num_senders=2


# dump stats every n msgs

log_interval=1000
This file must be the same for all nodes, so it is suggested to place it in a shared file system, e.g. an NFS mounted directory.
The following parameters are used:
| transport |
An implementation of Transport |
| num_msgs |
Number of messages to be sent by
a sender |
| msg_size |
Number of bytes of a single
message |
| num_members |
Number of members. When members
are started, they wait until num_members nodes have joined the cluster,
and then the senders start sending messages |
| num_senders |
Number of senders (must be less
then or equal to num_members). This allows each receiver to compute the
total number of messages to be received: num_senders * num_msgs. In the
example, we'll receive 2 million 1K messages |
| log_interval |
Output about sent and received
messages will be output to stdout (and to file if -f is used (see
below)) every log_interval messages |
The options for the test driver are:
bela@laptop /cygdrive/c
$ java org.jgroups.tests.perf.Test -help
Test [-help] ([-sender] | [-receiver]) [-config <config file>] [-props <stack config>] [-verbose] [-jmx] [-dump_stats] [-f <filename>]
| -sender / -
receiver |
Whether this process is a sender
or a receiver (a sender is always a receiver as well) |
| -config
<file> |
Points to the configuration
file, e.g. -config /home/bela/config.txt |
| -props
<props> |
The JGroups protocol stack
configuration. Example: -props c:\fc-fast-minimalthreads.xml. Can be
any URL |
| -verbose |
Verbose output |
| -jmx |
Enables JMX instrumentation
(requires JVM with JMX MBeanServer, e.g. JDK5). This will cause the VM
not to terminate when done. To access the process via JMX, the
-Dcom.sun.management.jmxremote property has to be defined and jconsole
can be used. For more details see http://wiki.jboss.org/wiki/Wiki.jsp?page=JMX. |
| -dump_stats |
Dumps some JMX statistics after
the run, e.g. number of messages sent, number of times blocked etc |
| -f
<filename> |
Dumps number of messages sent,
message rate, throughput, current time, free and total memory to
<filename> every log_interval milliseonds. This is the main tool
to generate charts on memory behavior or message rate variance |
| -help |
This help |
The files needed to run te tests are included with JGroups (source distribution) as well: JGroups/conf/config.txt is the test configuration file, and JGroups/conf/{udp,sfc,tcp}.xml are the JGroups protocol stack config files. Note that all the test runs will have the JGroups stack configuration file included so that they can be reproduced.
For additional details on how to run the tests refer to http://wiki.jboss.org/wiki/Wiki.jsp?page=PerfTests.
Parameters
The parameters that are varied are:- Cluster size: 4, 6 and 8
- Number of senders: N (where N is the cluster size); every node in
the cluster is a sender
- Number of messages: 1 million (constant, regardless of cluster
size)
- Message size: 1K, 2.5K and 5K
- Switch: 1GB/sec
- Protocols: IP multicast-based transport with FC as flow control
(udp.xml), IP multicast-based transport with SFC as flow control
(sfc.xml) and
TCP-based transport (tcp.xml)
- JVMs: SUN JDK5
- JGroups 2.5
Results
The plain results are available here for the 4 node cluster, here for the 6 node cluster and here for the 8 node cluster. The OpenOffice spreadsheet containing all results can be obtained here.The performance tests were run on the 3 clusters, measuring message rate (messages received/sec) and throughput (MB received/sec), as described in http://wiki.jboss.org/wiki/Wiki.jsp?page=PerfTests.
The JGroups configurations used are:
- UDP (udp.xml):
uses IP multicast in the transport, with FC as flow control
implementation
- SFC (sfc.xml): uses IP multicast in the
transport, with SFC as flow control implementation
- TCP (tcp.xml): uses multiple TCP connections in the transport
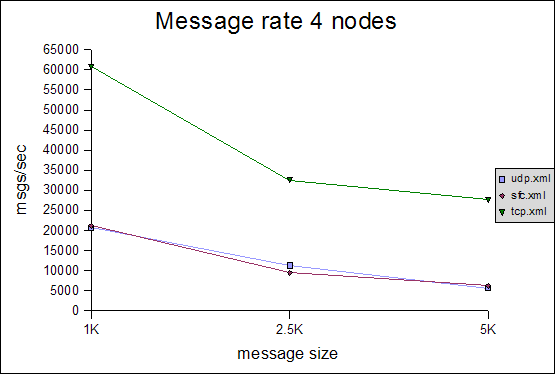
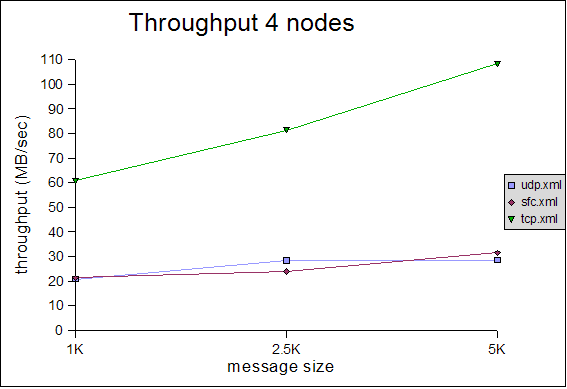
Message rate and throughput
The Y axes define message rate and throughput, and the X axis defines the message size. The message rate is computed as <number of messages sent> * <number of senders> / <time to receive all messages>. For example, a message rate of 35000 for 1K means that a receiver received 35000 1K messages on average per second. On average means that - at the end of a test run - all nodes post their results, which are collected, summed up and divided by the number of nodes. So if we have 2 nodes, and they post message rates of 10000 and 20000, the average messsage rate will be 15000.The throughput is simply the average message rate times the message size.
4 node cluster
 |
 |
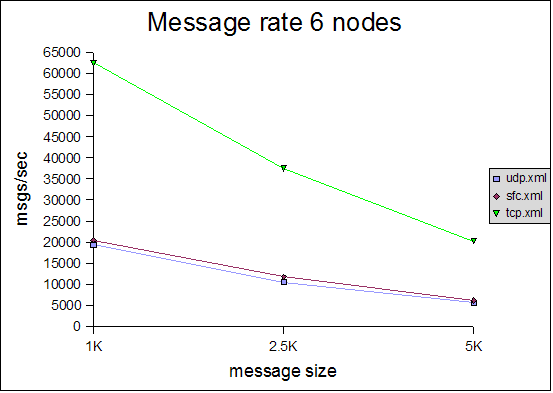
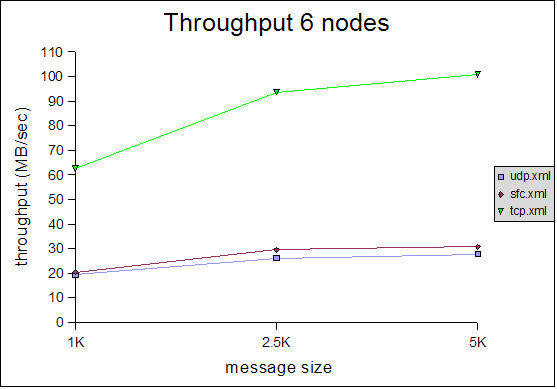
6 node cluster
 |
 |
8 node cluster
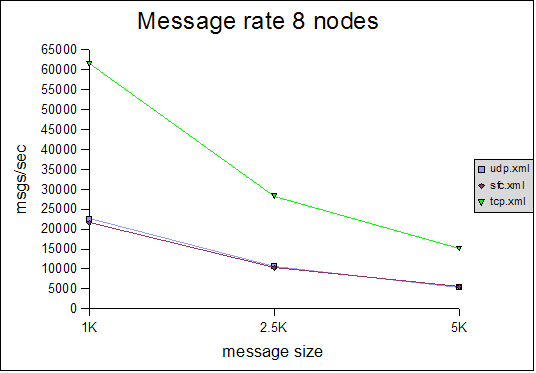 |
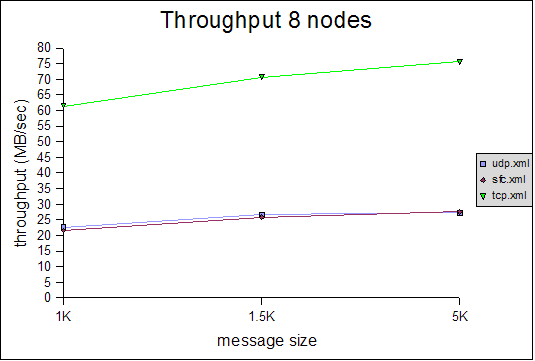 |
Interpretation of results
General
All of the tests were conducted with a relatively conservative configuration, which would allow for the tests to be run for an extended period of time. For example, the number of credits in flow control was relatively small. Had we set them to a higher value, we would have probably gotten better results, but the tests would not have been able to run for an extended period of time without running out of memory. For instance, the number of credits should be a function of the group size (more credits for more nodes in the cluster), however, we used (more or less) the same configuration for all tests. We will introduce an enhanced version of the flow control protocol which dynamically adapts credits, e.g. based on free memory, loss rate etc, in http://jira.jboss.com/jira/browse/JGRP-2.The message rate and throughput is much better for the TCP-based configuration than for either SFC or FC, in all 3 cluster configurations (4, 6 and 8 nodes). Although the rate falls with increasing message size, throughput actually increases slightly with increasing message size in all configurations. Note that for 6 and 8 nodes, TCP has a throughput of around 100MB/sec, which uses 80% of the gigabit switch's capacity (ca 125MB/sec) ! Compared to a previous performance test, we increased the MTU of all NICs to 9K and enabled jumbo frames, which allows us to send bigger ethernet packets, which positively affects throughput (not necessarily message rate).
We attribute the better performance of TCP to the following issues:
- The loss rate for IP multicast packets is usually 0%, but when
the switches do start dropping packets, then they drop almost all of IP
multicast packets (80% or so). This leads to retransmission, which is
costly. Currently, we use a static retransmission timeout mechanism,
which doesn't take actual retransmission times into account. This will
be changed in 2.6, where we take retransmission times
and loss
rate/memory size into account (). The dynamic retransmission
timeouts will allow us to retransmit message faster when everything is
good, and back off when the network is overloaded, similar to TCP's
exponential backoff algorithm.
- The challenge for the new flow control is to send packets as fast
as possible but not faster than the point where the multicast loss rate
gets significant. A new flow control protocol (scheduled for 2.6 or
2.7) will therefore take loss rate into account and start throttling
senders as soon as the loss rate increases (e.g. by reducing available
credits). This is similar to TCP where the sliding window size is
reduced on packet loss.
The throughout of UDP/SFC ranges from 20MB/sec for 1K messages to 30MB/sec for 5K messages, regardless of cluster size. In the case of TCP, throughput increases more with large messages, however we noticed that the relative throughput decreases with increasing cluster size. We suspect that throughput for TCP is a function of the cluster size (as we have a mesh of TCP connections, from everyone to everyone else). It will be interesting to see how TCP scales in large clusters, compared to UDP/SFC.
Issues:
- Static flow control in JGroups: FC doesn't dynamically adjust the
number of credits based on the number of nodes in a cluster, but this
is defined statically in the config file. We suspect these settings are
okay for smaller clusters, but would need to be adjusted for larger
clusters. We plan to write a new flow control protocol in JGroups 2.6, which
is based on credits (like the existing one), but also takes into
account latency, message loss and number of retransmissions and free
memory.
- No OS/NIC optimizations: in RHEL (and other Linux distributions), buffer sizes (IP, network card) for incoming packets, and other parameters can be configured. For example, larger buffer sizes lead to less chance of losing packets because of full buffers.
- No switch optimization: we used the GB switch unchanged and
haven't yet investigated switch tuning. For example, if the switch
implements traffic prioritization (e.g. 802.1p), then IP
multicasts have low priority. Same goes for IGMP snooping:
when enabled, it slows the switch/router down because each single
multicast packet has to be examined for whether it is an IGMP packet,
or just a regular multicast packet. If disabled, the multicasts would
be copied to all ports, which doesn't matter in our test because all
ports have 1 multicast member connected.
- Logging: we log performance data to disk every N messages
(default=100000). During the tests we logged to an NFS mounted file
system, which incurs one RPC. It would have been better to log to a
local disk (e.g. /tmp), but we didn't want to change the tests half-way
through
Processing of messages and scalability
The test program currently doesn't do any processing at the receiver when a message is received. Instead, a message counter is increased and the size added to the total number of messages received so far. This is of course an ideal situation, and not realistic for normal use, where receivers might unmarshal the message's byte buffer into something meaningful (e.g. an HTTP session), and process it (e.g. updating an HTTP session). (The test by the way allows to take processing time at the receiver into account by setting the processing_delay value).JGroups 2.5 should process messages which are handled by receivers (that do some processing on reception of a message) much better, as we introduced the concurrent stack in 2.5. Preliminary measurements show that the performance speedup compared to 2.4 (a) for messages which take some time (a few milliseconds) to process and (b) for clusters where everyone sends messages, is close to N where N is the number of nodes sending messages. We will publish numbers for these types of scenarios later.
Fluctuation of results (reproduceability)
Compared to the 2.4 performance tests, we didn't run the tests multiple times. Instead, we ran each test only once, so the numbers shown are not averaged over multiple runs of a given test. We also didn't adjust the JGroups configs for the different cluster sizes. For example, the number of credits in flow control (FC and SFC) should have been increased with increasing cluster size. However, we wanted to see whether we get reasonable numbers for the same configs run on different clusters.If you run the perf tests yourself and get even better numbers (sepecially for UDP/SFC), we'd be interested to hear from you !
Conclusion and outlook
We showed that performance of JGroups is good for clusters ranging from 4 to 8 nodes. TCP scales better than UDP, however it also creates a mesh of connections (every sender needs to be connected to everyone else in the cluster), which may not scale to large clusters.We intend to measure the performance of larger clusters (16 - 80 nodes) in a later round of benchmarks.